Restricted access
Equality, diversity and inclusion (EDI) is rising to the top of the agenda for an increasing number of organisations. There is a realisation that structural factors can prevent people who belong to minority groups from joining and engaging in their activities, and that it is important to address those barriers.
In 2020, the ITI board placed EDI firmly on its agenda too. A small working group of volunteers was formed to assess current practices and suggest ways to ensure that members from all categories could feel at home within the institute. We soon realised that it would be impossible to identify actions and goals, and monitor progress, without first knowing who ITI’s members were. We decided to develop a survey to collect anonymous data on a wide range of characteristics: from age and ethnicity to disability and socio-economic status.
We designed the survey using information from several sources, primarily the EDI subgroup of the Professional Associations Research Network (PARN) and the experiences of its members. In January 2022 we tried out the survey on the ITI board as a usability test and to assess whether ITI’s elected member representatives reflected the demographics of the wider membership.
We would like to thank everyone who responded, and hope to run the survey again in due course to help ensure that ITI is supporting its members as best it can.
The survey consisted of a mix of closed and open-ended questions covering a range of topics. In total, we received 674 responses (22 per cent of ITI members at the time), 549 of which were complete responses (18 per cent of ITI members). On the advice of other PARN members, we included a ‘prefer not to say’ option for all questions to ensure that respondents could skip any questions they did not wish to answer. All data were anonymised.
Once the responses were in, our first task was to compare the results with the anonymised membership data held by ITI. The data on age, gender, and membership category showed that the survey respondents were a good representation of the overall ITI membership. The gender breakdown of respondents differed from that of the ITI membership as a whole (as recorded by the ITI office) by less than 2 per cent.
In terms of ages and membership categories, however, the discrepancies were more marked: we received more answers from older members (the average age of respondents was 51, whereas that of members is 49) and from more experienced and higher-grade members (MITIs contributed 60 per cent of the survey responses although they make up only 50 per cent of the membership).
Unless marked otherwise, the data in the figures and graphs below reflect the data collected in the EDI survey.
As many people probably suspected, the typical ITI member is white, female and middle-aged. But read on, and you’ll find that we’re a broader church than that would suggest.
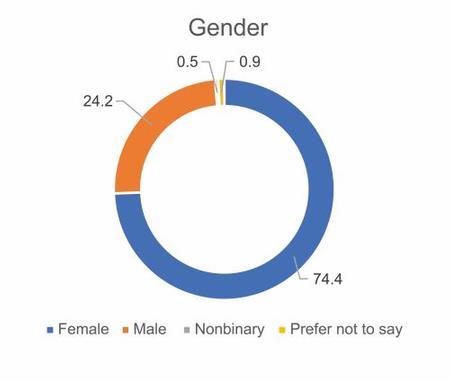
This is one of the key descriptors that most significantly differentiate the ITI membership from the general population.
Currently, 74.4 per cent of ITI members are women, and 24.2 per cent are men, compared with 51.7 per cent and 48.3 per cent respectively in the population of England and Wales aged over 20 years (according to the 2021 census).
The gender difference is starker still on the board: in the January 2022 pilot survey, 82 per cent of board members were women, and as of May 2022 there is only one male board member (excluding the chief executive, who is not an ITI member).
A small percentage of ITI members are nonbinary, and a similar number reported having a different gender at birth.
The survey received a relatively low number of responses from younger members, demonstrated by the fact that the average age of members in the Student category who sent in responses was 49. Nonetheless, it clearly indicates that the age distribution of the institute is skewed towards older members. By contrast, the average age of board members is a youthful 44.
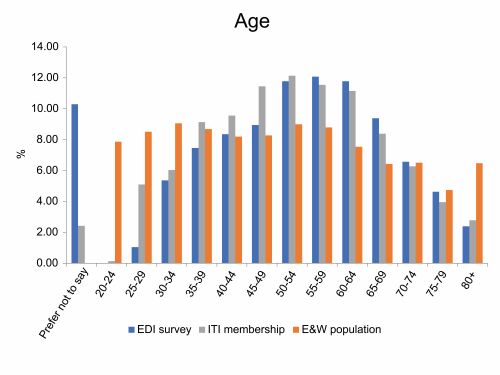
Figure 2: Age distribution of ITI members who completed the 2022 EDI survey, in comparison with that of the ITI membership as a whole and the England and Wales population
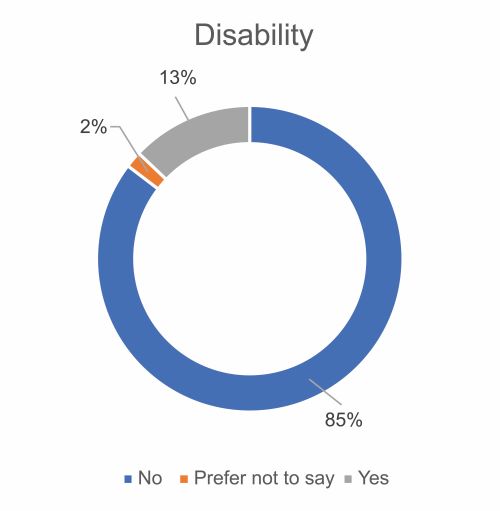
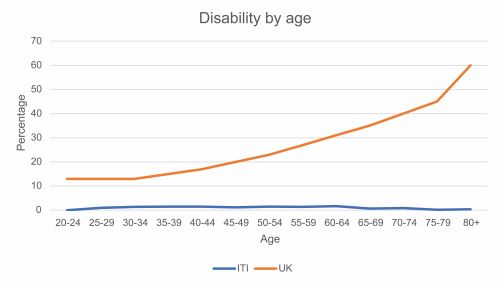
Almost 13 per cent of respondents reported having a disability, compared with the 21 per cent reported among working-age adults in the general population (calculation by the charity Scope). However, the distribution of people with disabilities increases with age. With many ITI members retiring and terminating their membership in their 70s and beyond, we should view our data through that lens.
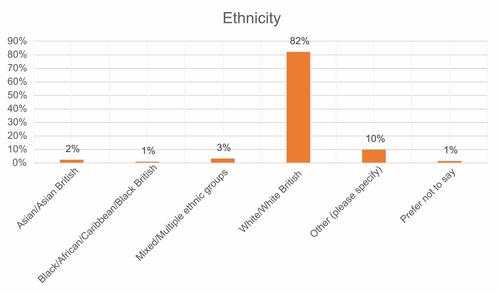
Collecting data on ethnicity is a complex issue, perhaps even more so among such a diverse group as translators and interpreters. We therefore decided to use the broad categories provided in the 2021 England and Wales census. We provided a free text box for respondents who felt that those categories provided insufficient scope to describe their identity. In 2019, the White/White British category constituted 84 per cent of the population of England and Wales, and 82 per cent of survey respondents.
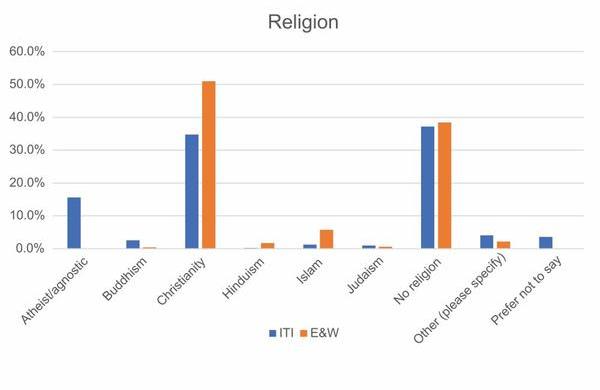
The data collected on members’ religious beliefs corresponded reasonably well to the population of England and Wales, although the proportion of Christian, Muslim and Hindu members is lower than among the general population.
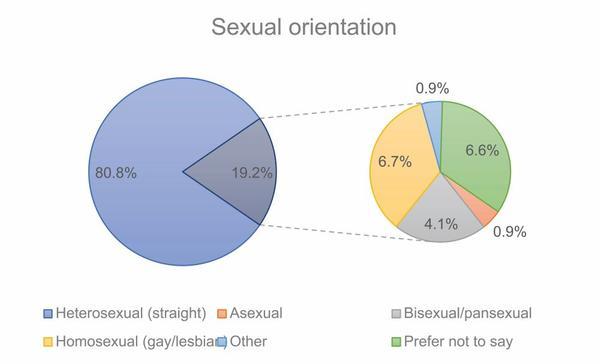
The sexual orientation of survey respondents shows much greater diversity than in the general population. According to the Office of National Statistics, 2.7 per cent of the UK population identifies as lesbian, gay or bisexual, in comparison to 12.6 per cent of survey respondents.
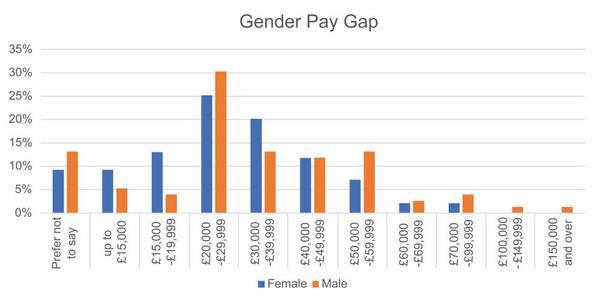
These data provide a demographic snapshot of the ITI membership. However, there is more than demographics to explore. In addition to the data represented in these graphs, we also collected information on income, location, qualifications, working arrangements and accessibility issues. This will enable us to conduct intersectional analyses to investigate issues of interest to ITI and its members. These include a potential gender gap in terms of income (see Figure 8), the higher level of disability reported among translators than interpreters, and the lower level of engagement among younger members.
The survey data provide interesting insights into the make-up of the ITI membership. But collecting and analysing data on the basic characteristics of ITI members is just the beginning. Our aim is to promote equality, diversity and inclusion among existing members and to broaden the appeal of our institute.
Some of the survey questions were open-ended, offering respondents an opportunity to make comments and suggestions. This provided valuable insights into members’ concerns. We are in the process of categorising and analysing their observations to prepare an action plan for the board to consider.
Addressing members’ concerns could be vital to the long-term success of the institute. We need only consider the hybrid conference held earlier this year: the option to attend online meant that over 100 members who would otherwise have been left out were able to actively participate in the biggest event in ITI’s calendar – people with disabilities and/or other members who find travel difficult, young parents with childcare commitments, or people with low incomes for whom the travel and accommodation costs would have been prohibitive.
Now that we’ve made a start on identifying ITI members’ characteristics, it will be useful to track this information so that the institute remains relevant. In 10 years’ time, will more members have postgraduate qualifications, and will having these effectively become a requirement for language professionals? Will we have more members working part-time and combining work with childcare or other jobs? As retirement ages increase, will more members keep working into old age?
We want translators and interpreters of all backgrounds to feel that they can join in ITI’s activities as full and active members of the ITI community. We want to recognise and address the concerns that existing members have expressed, and provide a welcoming environment for potential new members. To do so, we need to know who our members are and the obstacles they face. We are therefore excited to continue this work and hope that our members will continue to support ITI’s progress on equality, diversity and inclusion.
This article first appeared in the September-October 2022 edition of ITI Bulletin.

If you would like to read more features and articles on a wide variety of subjects relating to all aspects of the translation and interpreting industry, subscribe to ITI Bulletin. Alternatively, join ITI and get a free subscription included in your membership.